- Center on Health Equity and Access
- Clinical
- Health Care Cost
- Health Care Delivery
- Insurance
- Policy
- Technology
- Value-Based Care
Patient Preferences for Provider Choice: A Discrete Choice Experiment
The authors used a discrete choice experiment to analyze patient preferences for attributes of provider choice, including wait time, breadth, travel time, continuity of care, and monthly premium.
ABSTRACT
Objectives: There is an ongoing policy discussion regarding an adequate breadth of provider networks. Health plans with “restricted networks” of providers have proved surprisingly popular on the Affordable Care Act health insurance exchanges because of a substantial gap in premiums between plans with open networks and closed networks. The objective of this paper is to assess which other attributes of the provider network matter to patients when choosing health insurance.
Study Design: We used a discrete choice experiment to analyze the effect of previously unobserved characteristics regarding provider networks on plan choice, including wait time, breadth, travel time, whether the plan covers care for their personal doctor, and monthly premium. Hypothetical plan options were offered to respondents of an online survey using Qualtrics software.
Methods: We used mixed multinomial logit models to estimate preference-based utilities for attributes of primary care provider networks and willingness to pay.
Results: Coverage of a personal doctor was the most important attribute, followed by premium, wait time to see a primary care provider, the breadth of the network, and travel time to the closest doctor covered by the plan. Respondents were willing to pay $95 per month to have a plan that covers care for their personal doctor, and they were willing to wait 6 days for an appointment to have a plan covering care for their personal doctor.
Conclusions: The results of this study provide new insights to federal and state legislators developing new models or standards on network adequacy and patient decision support tools.
Am J Manag Care. 2020;26(7):e219-e224. https://doi.org/10.37765/ajmc.2020.43761
Takeaway Points
- There is an ongoing policy discussion regarding an adequate breadth of provider networks.
- This is the first study to elicit patients’ preferences regarding provider choice and provider network adequacy.
- The results of this study provide new insights to federal and state legislators developing new models or standards on network adequacy and patient decision support tools.
The adequacy of provider networks in health insurance plans has become a topic of interest for policy makers. Recent years have seen a reemergence of restricted network plans, in which insurers offer plan choices with a lower premium in exchange for a limited network of covered providers. The plans have proved surprisingly popular on the Affordable Care Act (ACA) health insurance exchanges because of a substantial gap in premiums between plans with open networks and closed networks. Plans with larger networks have premiums between 6% and 13% higher than those with smaller networks in ACA marketplaces.1 However, there are concerns about whether more-limited provider networks provide meaningful provider access.
Consumers may also not have appropriate information to make well-informed decisions, particularly regarding provider networks, or may not actively seek information. Indeed, the consumer-directed health care vision of consumers actively shopping is far removed from the reality of how most consumers currently choose health care providers.2 In addition, previous research has shown limited use of price information, which likely reflects the fact that most insured consumers have little or no financial incentive to compare provider prices because their out-of-pocket expenses stay constant across in-network providers.2 At the same time, consumers are not fully aware of the provider network configuration of their plan. The National Association of Insurance Commissioners recently drafted model legislation regarding out-of-network billing to reduce medical bills, but it remains a challenge to set exact minimum standards for qualified health plans (QHPs) in the marketplace.
One approach developed “T-shirt size” standards for the breadth of the provider network, which represents the percentage of providers covered by a plan compared with the total number of providers in the county. These standards categorize network size into 5 groups: extra-small (< 10%), small (10%-25%), medium (25%-40%), large (40%-60%), and extra-large (> 60%).3
The focus on network size, however, ignores other important aspects of network adequacy. Prior research suggests that patients heavily value having their personal doctor (ie, a doctor they have an existing relationship with) in the network and that coverage of an individual’s preferred provider is more important than overall network size.4-8 Higuera and colleagues, for example, found that if that a network covers their usual source of care, consumers show aversion only to the narrowest networks.4 Another attribute of provider networks that may matter is the maximum time and distance patients are willing to travel to the nearest provider covered by their insurance plan. Haeder and colleagues showed in a recent study that distances are relevant to consumers, especially those with limited resources and travel options.5 Drake measured the breadth of provider networks in terms of distance: the percentage of primary care providers (PCPs) covered by the network within a 15-mile radius of a given geography.6 He emphasized the importance of future research to learn which particular network characteristics (eg, high-reputation providers, distance) drive consumers’ sensitivity to network breadth. Indeed, these and other attributes, such as wait time to see a doctor or recommendations from family and friends, may be equally (or more) important. Certainly, for Medicaid enrollees, finding providers who will provide appointments in a timely manner has been an area of concern.
Despite the strong policy interest in network adequacy and regulatory efforts to mandate standards, there is surprisingly little published research on patient preferences for network design. An extensive literature addresses the relation between network breadth and premium pricing, such as a study by Dafny and colleagues that suggested that network breadth/valuation is not tightly linked to plan pricing.7 The authors concluded that this is likely due (at least in part) to the substantial uncertainty surrounding the first year of the marketplaces and perhaps the difficulty in assessing network breadth. Haeder and colleagues emphasized the need for information about provider networks and that accessing services for patients with acute conditions was particularly troubling.8 They concluded that effectively addressing issues of network adequacy requires more accurate provider information. Although current efforts to design network standards are intended to improve patient welfare, there is a lack of evidence about patient preferences for networks. A more complete picture of patients’ preferences regarding provider choice will help in formulating a better definition of network adequacy to maximize patient welfare.
METHODS
In this study, we used a discrete choice experiment (DCE) to assess which attributes of the provider network matter to patients when choosing a health insurance plan. Our conceptual model was based on health insurance demand theory, which emphasizes the role of expected utility in choice optimization. We created synthetic plan alternatives and had respondents from a nationally representative sample select their preferred options. This method allows us to study patient preferences for plan attributes that are not available in secondary data sets. We hypothesized that patients are willing to pay more for some of these attributes, such as continuing to see a personal doctor, than for the amount of provider choice.
Experimental Design
Attribute identification and level assignment. The first step in our analysis was to build the survey. We first asked basic demographic questions and then proceeded to the choice tasks. In the choice tasks, respondents were told that the plans differed in 5 ways and that everything else about the plans, including the benefits, was identical. The plans would differ along the following attributes:
- Breadth of the doctor network, which was defined as the percentage of primary care doctors in the respondent’s service area that accept the health insurance plan. Options presented were 20%, 50%, and 80%. Twenty percent was defined in the survey as indicating that 20% of the primary care doctors in the respondent’s area accept the health insurance plan.
- Travel time to closest primary care doctor in the network, which was defined as the amount of time it would take to drive to the closest primary care doctor who accepts the insurance plan. Options were 10, 20, and 30 minutes.
- Participation in network by current primary care doctor, which was defined as the respondent’s current primary care doctor accepting the health insurance plan and care with this doctor being partly or fully covered by the plan. Options were “in the network” and “not in the network.”
- Waiting time to see a primary care doctor, which was defined as the number of days to wait to get an appointment for nonemergency care with a primary care doctor covered by the plan. Options were 1, 4, and 7 days.
- Monthly premium, which was quantified as $320, $360, and $400.
The Figure shows the attributes and the different levels and an example of a choice set in the DCE. A discussion of the statistical design and the methods for identifying the levels is included in the eAppendix (available at ajmc.com).
After a brief orientation to the concept of provider networks, each participant was asked to choose an insurance plan option. Respondents were presented 3 choices of health insurance plans that differed in the 5 attributes and asked to pick the plan that they preferred. This choice task was then repeated 11 times, with each choice task presenting the respondent with 3 new insurance plan options. The Figure also illustrates an example of a choice task that respondents would see in the survey.
Data
Respondents were sampled based on nationally representative Census data. Our data were drawn from an established online panel developed by Qualtrics. The panel has been used previously for academic research, including education choices, studying pharmacy residency programs, psychiatrists’ attitudes toward mental disorder classification, and running online reaction time experiments.9-13
Qualtrics contacted approximately 10,000 individuals through website intercept recruitment, member referrals, targeted email lists, permission-based networks, and social media and invited them to participate in the survey. Of the 10,000 individuals who received the invitation, 7208 elected to participate in the survey (72.1% response rate). Of the 7208 who were willing to participate, 5704 were eliminated for failing consistency criteria, qualifying for a closed quota, or failing an attention check. Of the remaining 1504 individuals, 1020 were selected based on demographic characteristics to create a nationally representative sample based on age, gender, and race. Respondents with unrealistic values for some open-ended questions or missing values were removed, creating a final analytic sample of 992 respondents.
Analytic Approach
Mixed multinomial logit models. We used mixed multinomial logit (MMNL) models to estimate preference-based utilities for attributes of the provider network. The MMNL model does not exhibit the strong assumptions of independent and identically distributed error terms and the independence of irrelevant alternatives property of standard conditional logit models and allows for random taste variation, unrestricted substitution patterns, and correlation in unobserved factors.14 The MMNL model makes it feasible to derive individual-specific estimates conditional on the observed individual.15-17
In our model, expected overall utility U of respondent i from insurance plan j at the cth choice situation is given by:
Uijc = β1iWaitTimeijc + β2iBreadthijc + β3iTravelTimeijc + B4iPersonalDoctorijc + β5iMonthlyPremiumijc + εijc
The MMNL model estimates the probability of the observed sequence of choices and its choice probability is then given by:


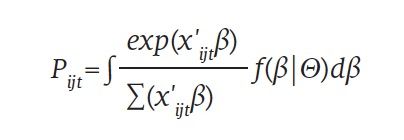
where f(β|Θ) is the density function of β. Different distributional assumptions can be used for the density function; we assumed a normal distribution.
We also used MMNL models that incorporated individual characteristics into the random coefficients by including interactions. We included health status because we believed that self-reported health could explain some of the variation in the strong preference for the breadth of the network. We also included an interaction of female sex and coverage of a personal doctor because we hypothesized that some of the variation in personal doctor could be explained by gender. Women often like having female doctors, so keeping a personal doctor might be more important to them. We also included an interaction of respondents in the highest income group (>$100,000) and the wait time to see a doctor to reflect the different opportunity cost of waiting. We conducted sensitivity checks with different parameter distributions, which were all approximately normal. In the models, we transformed the coefficients to represent either willingness to pay (WTP), which shows the mean WTP for a 1-unit change in the attribute in dollars, or willingness to wait (WTW), which is similar except the units are days (a detailed discussion is in the eAppendix). We also estimated the price elasticity of demand for narrow network plans (or plans with various provider network characteristics) to know to what extent demand for narrow network plans is sensitive to changes in price.
RESULTS​​​​​​​
Sample Size and Characteristics
Table 1 reports the descriptive characteristics of the sample. A total of 1020 respondents completed the discrete choice sets and, after deleting observations with missing or unrealistic values, our sample had 992 respondents. The median age was 33 years. The gender split was representative: 47% of the sample were men and 53% were women. About 48.7% of the respondents were Caucasian; 16.2%, African American; 11.9%, Asian American; 21.3%, Hispanic; and 1.9%, other racial/ethnic background. About half of the sample lived in a suburban area (47.3%); one-third, in an urban area (34%); and one-fifth, in a rural area (18.7%).
MMNL Results
MMNL base model. The results of the base MMNL model are reported in Table 2. The results show that the coefficients are all significant and have the expected signs: On average, patients like shorter wait times to see a doctor, a broader network of primary care providers, shorter travel time to get to the nearest provider covered by the plan, having their personal doctor in the plan, and lower premiums. The (fixed) premium coefficient is negative and statistically significant (β = —0.0085; P < .001). Attributes other than premium are random and normally distributed. The coefficient on “my doctor accepts this plan” (β = 0.8105; P < .001) and “breadth of the provider network” (β = 0.0206; P < .001) is positive and significant. The coefficient is negative and significant on “travel time to closest doctor covered by the plan” (β = —0.0045; P < .01) and “wait time to see primary care doctor covered by the plan” (β = —0.1315; P < .001).
The statistically significant coefficients of the SD show a considerable amount of heterogeneity in preferences for all the insurance plan attributes. In other words, patients have diverse preferences for attributes of insurance plans related to provider choice, based on individual differences. We compared the results of models with different distributional assumptions for some of the attributes, such as the negative lognormal and the triangular, and found that the results were robust to different specifications.
MMNL model with interactions. Table 3 reports the results of the MMNL model, including individual characteristics used to explain the coefficient distributions. We found that all the interaction terms we included are statistically significant, which implies that we can explain some of the systematic differences by individual characteristics.
As hypothesized, the interaction of health status and the breadth of the network was positive and significant. Higher values of self-rated health indicate lower levels of health in this survey, indicating that sicker respondents care more about having a broader network of providers than healthier respondents. The interaction of being female and coverage of a personal doctor was also positive and significant: Women care about having a personal doctor and are more likely to pick an insurance plan that covers care for a personal doctor. Also expected was the negative interaction of high income and wait time; respondents with higher income care more about wait time.
We also analyzed models that allowed the random coefficients to be correlated. This more flexible model showed that the main results in this model were robust to the less flexible specification.
WTP and WTW. Table 4 reports the WTP and WTW estimates based on the MMNL model results from Table 2. The (fixed) premium coefficient is negative and statistically significant (β = —0.0085; P < .001). Attributes other than premium are random and normally distributed. The coefficient is positive and significant on “my doctor accepts this plan” (β = 0.8105; P < .001) and “breadth of the provider network” (β = 0.0206; P < .001), whereas “travel time to closest doctor covered by the plan” (β = —0.0045; P < .01) and “wait time to see primary care doctor covered by the plan” (β = —0.1315; P < .001) are negative and significant. We compared the results of models with different distributional assumptions for some of the attributes, such as the negative log normal and the triangular distributions, and concluded that this model was the best fit although the results were robust to various specifications (such as log normal for the doctor attribute).
Holding all other plan attributes constant, respondents were willing to pay $95 (95% CI, $83-$107) to get an insurance plan that covers care for their personal doctor. This is higher than what they were willing to pay for the other attributes: Respondents were willing to pay $72 for a plan that covered 30% more doctors in their area, $45 to get a plan that would get them to see a doctor 3 days sooner, and $5 to have a doctor covered that would save them 10 minutes of travel time. This indicates respondents were willing to pay as much to have a personal doctor covered by the plans as they were to have a plan with a 39% broader network.
The WTW estimates reflect how much wait time to see a doctor respondents are willing to trade off in terms of the other attributes. Respondents were willing to wait 6.13 (95% CI, 5.19-7.13) days to see a primary care doctor to have a plan that covers care with their personal doctor. Table 4 also presents the premium elasticity estimate, which is based on the values of the attributes. This number suggests a relatively inelastic demand (η = —0.0496), which implies that respondents in the survey were not very price responsive when choosing health insurance plans based on provider network characteristics; this number is on the lower end of what other investigators have reported in the literature.18
DISCUSSION​​​​​​​
This paper set out to address the ongoing debate about adequacy of provider networks in health insurance plans. We found that coverage of a personal doctor was positively and significantly associated with plan choice, as was breadth of the provider network. Wait time, travel time, and premium were negatively and significantly associated with plan choice. We also found that respondents, holding all other plan attributes constant, were willing to pay a substantial amount ($95) to have a plan that covers a personal doctor. This number is in line with what Higuera and colleagues reported; they found that WTP for a network that covers consumers’ usual source of care is between $84 and $275 per month for primary care.4
One potential policy concern is the effect of narrow networks on inertia in health plan choice. We find that individuals are willing to trade off their personal doctor for a broad network. However, an environment with narrow networks and extensive exclusive networks could be problematic; individuals would be restricted to either their current plan and doctor or alternative plans without either a broad network or their doctor. This could create market power for health plans. However, this market power could be mitigated by the option of broad network alternatives.
Limitations
The goal of a DCE is to understand what trade-offs respondents are willing to make, but attributes may not always be mutually exclusive and we may not be able to allow for the error terms of the attributes to be correlated. This may create an unrealistic representation of reality. For example, inclusion of a preferred physician may go hand in hand with choosing the narrowest network. Ho and Lee addressed this in a study evaluating provider network regulation in which they uncovered circumstances when private incentives of an insurer diverge from social or consumer preferences and they found that networks may not be too narrow from either a social or consumer welfare perspective.19 We did analyze models that allowed the random coefficients to be correlated, which showed that the main results were robust to the less flexible specification.
CONCLUSIONS
There is an ongoing policy discussion regarding an adequate “breadth” of provider networks. Health plans with “restricted networks” of providers have proved surprisingly popular on the ACA health insurance exchanges because of a substantial gap in premiums between plans with open networks and closed networks. This is the first study to elicit patients’ preferences regarding provider choice and provider network “adequacy.” Although the policy discussion about network adequacy centers around the breadth of the provider network, patients place higher relative importance on coverage of their personal doctor. The results of this study imply that providing more information about whether enrollees can stay with their current primary care doctor and making it easier to compare plans based on the “doctor finder” would add value to patients. It remains a challenge, however, for consumers to know whether one’s personal physician is in network and will continue to be in network throughout the contract year. If policy makers want to increase insurance competition in their area, they should make it easier for patients to search for a plan with their personal doctor and make sure that coverage for these doctors is for the entire 12 months before the next enrollment season. The results of this study provide new insights to those federal and state legislators developing new models or standards on network adequacy and patient decision support tools.Author Affiliations: Larner College of Medicine, University of Vermont (EMvdB-A, AJA), Burlington, VT.
Source of Funding: None.
Author Disclosures: The authors report no relationship or financial interest with any entity that would pose a conflict of interest with the subject matter of this article.
Authorship Information: Concept and design (EMvdB-A, AJA); acquisition of data (EMvdB-A); analysis and interpretation of data (EMvdB-A, AJA); drafting of the manuscript (EMvdB-A); critical revision of the manuscript for important intellectual content (EMvdB-A, AJA); statistical analysis (EMvdB-A); provision of patients or study materials (EMvdB-A); and supervision (AJA).
Address Correspondence to: Eline M. van den Broek-Altenburg, PhD, Department of Radiology, The Larner College of Medicine, University of Vermont, 89 Beaumont Ave, Burlington, VT 05405. Email: eline.altenburg@med.uvm.edu.REFERENCES
1. Polsky D, Cidav Z, Swanson A. Marketplace plans with narrow physician networks feature lower monthly premiums than plans with larger networks. Health Aff (Millwood). 2016;35(10):1842-1848. doi:10.1377/hlthaff.2016.0693
2. Tu HT, Lauer JR. Word of mouth and physician referrals still drive health care provider choice. Res Brief. 2008;(9):1-8.
3. Polsky D, Weiner J. State variation in narrow networks on the ACA marketplaces. University of Pennsylvania Leonard Davis Institute of Health Economics. August 2015. Accessed September 22, 2019. https://ldi.upenn.edu/sites/default/files/pdf/state-narrow-networks.pdf
4. Higuera L, Carlin CS, Dowd B. Narrow provider networks and willingness to pay for continuity of care and network breadth. J Health Econ. 2018;60:90-97. doi:10.1016/j.jhealeco.2018.06.006
5. Haeder SF, Weimer D, Mukamel DB. A consumer-centric approach to network adequacy: access to four specialties in California’s marketplace. Health Aff (Millwood). 2019;38(11):1918-1926. doi:10.1377/hlthaff.2019.00116
6. Drake C. What are consumers willing to pay for a broad network health plan? evidence from Covered California. J Health Econ. 2019;65:63-77. doi:10.1016/j.jhealeco.2018.12.003
7. Dafny L, Hendel I, Wilson N. Narrow networks on the health insurance exchanges: what do they look like and how do they affect pricing? a case study of Texas. Am Econ Rev. 2015;105(5):110-114. doi:10.1257/aer.p20151081
8. Haeder SF, Weimer DL, Mukamel DB. Secret shoppers find access to providers and network accuracy lacking for those in marketplace and commercial plans. Health Aff (Millwood). 2016;35(7):1160-1166. doi:10.1377/hlthaff.2015.1554.
9. Brusko L. Organized chaos: a survey of conflict management strategies, gender roles, and status in an organizational setting. UW-L Journal of Undergraduate Research XIII (2010). Accessed September 22, 2019. https://pdfs.semanticscholar.org/5bcf/4743b64d97e8718e99daabc2f47f41a0fa2f.pdf?_ga=2.204108048.1633410285.1591673670-553423190.1591673670
10. Christensen G, Steinmetz A, Alcorn B, Bennett A, Woods D, Emanuel E. The MOOC phenomenon: who takes massive open online courses and why? 2013. Accessed September 22, 2019. https://papers.ssrn.com/sol3/papers.cfm?abstract_id=2350964
11. Hauser DJ, Schwarz N. Attentive Turkers: MTurk participants perform better on online attention checks than do subject pool participants. Behav Res Methods. 2016;48(1):400-407. doi:10.3758/s13428-015-0578-z
12. Reed GM, Correia JM, Esparza P, Saxena S, Maj M. The WPA-WHO Global Survey of Psychiatrists’ Attitudes Towards Mental Disorders Classification. World Psychiatry. 2011;10(2):118-131. doi:10.1002/j.2051-5545.2011.tb00034.x
13. Ruggiero D. The effect of a persuasive social impact game on affective learning and attitude. Comput Human Behav. 2015;45:213-221. doi:10.1016/j.chb.2014.11.062
14. McFadden D, Train K. Mixed MNL models for discrete response. J Appl Econ (Chichester Engl). 2000;15(5):447-470.
15. Hensher DA, Greene WH. The mixed logit model: the state of practice. Transportation (Amst). 2003;30(2):133-176.
16. Sillano M, Ortúzar JD. Willingness-to-pay estimation with mixed logit models: some new evidence. Environ Plan A. 2005;37(3):525-550. doi:10.1068/a36137
17. Train K. Discrete Choice Methods With Simulation. Cambridge University Press; 2003.
18. Atherly A, Florence C, Thorpe KE. Health plan switching among members of the Federal Employees Health Benefits Program. Inquiry. 2005;42(3):255-265. doi:10.5034/inquiryjrnl_42.3.255
19. Ho K, Lee RS. Equilibrium provider networks: bargaining and exclusion in health care markets. Am Econ Rev. 2019;109(2):473-522.