- Center on Health Equity and Access
- Clinical
- Health Care Cost
- Health Care Delivery
- Insurance
- Policy
- Technology
- Value-Based Care
Distinguishing Biomarkers Identified in MS Outcomes
Results from this cohort study found that levels of glial fibrillary acid protein, cerebral spinal fluid, and neurofilament heavy chain are distinguishable biomarkers that are associated with disease outcomes in multiple sclerosis (MS).
Nonrelapsing progressive disease prognoses have been associated with neurofilament heavy chain (NfH) and activated glial markers and, furthermore, the long-term progression of multiple sclerosis (MS) has been linked to elevated glial fibrillary acid protein (GFAP) in cerebrospinal fluid (CSF), according to a recent study published in JAMA Neurology.
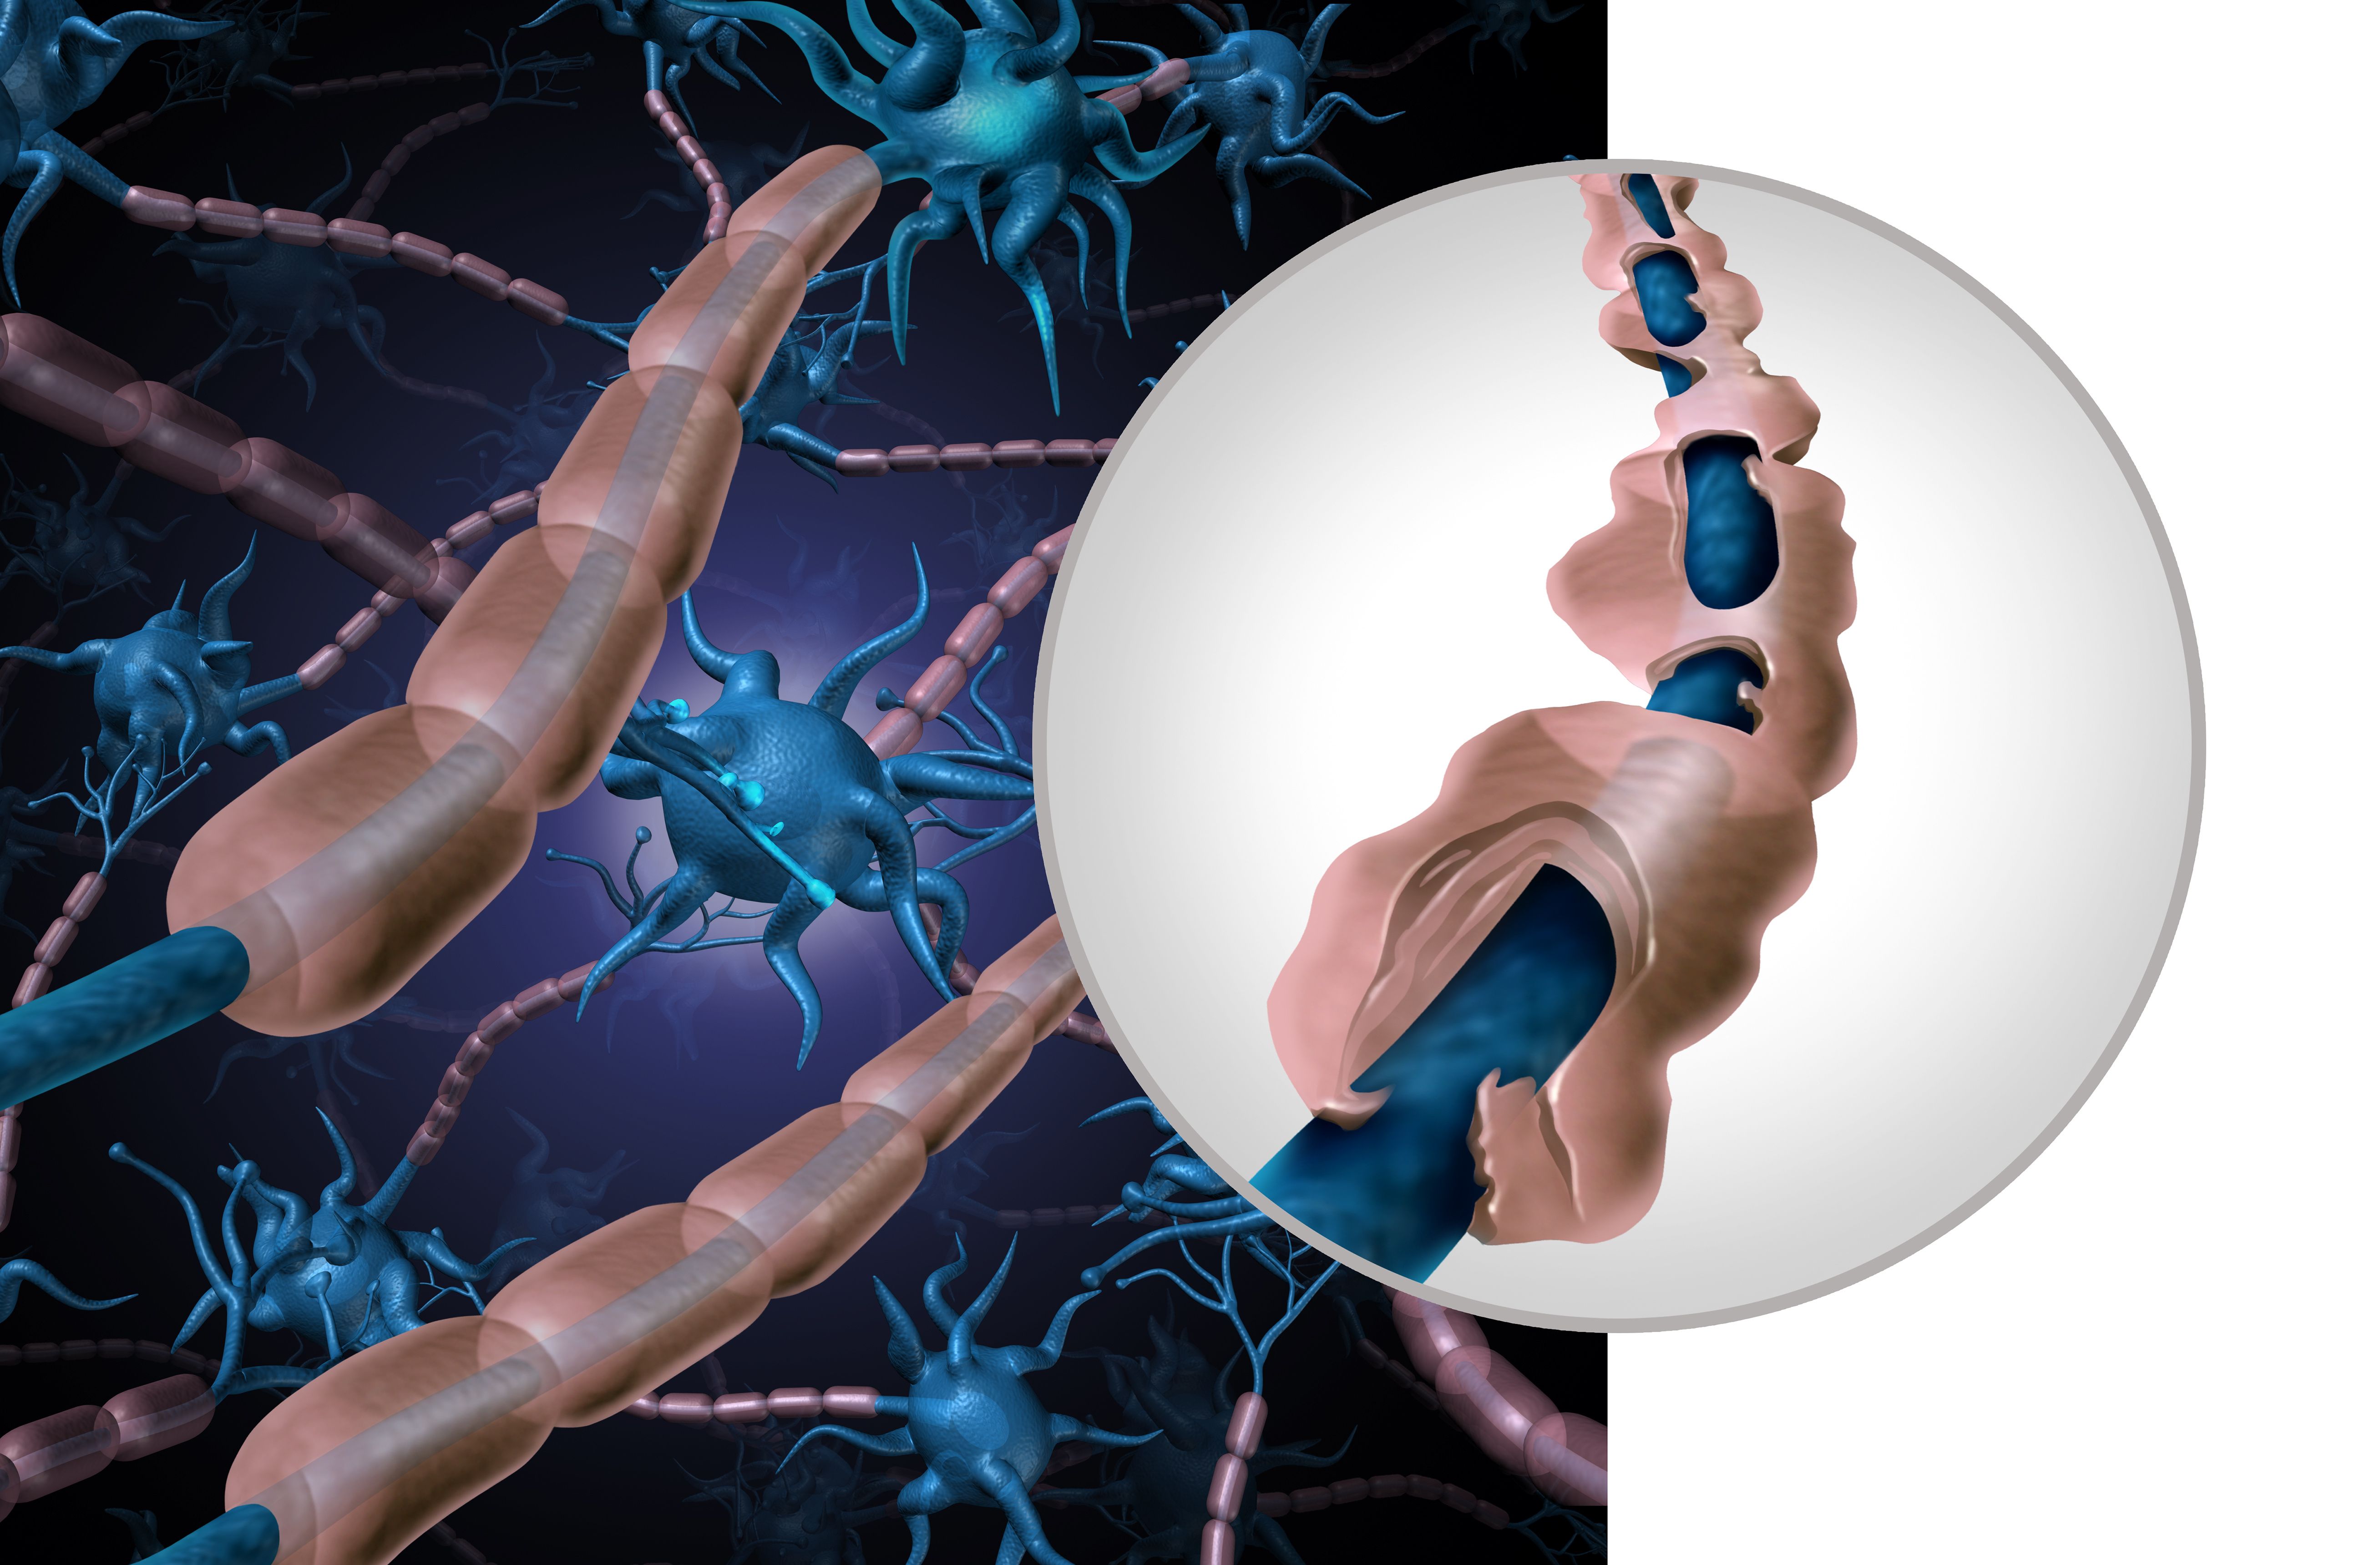
Demyelination MS Model | image credit: freshidea - stock.adobe.com

A remaining unmet need in MS is the identification of biomarkers that can represent disease progression. When clinicians consider the pathophysiology of MS, they survey the landscape of progressive lesions, neurodegeneration, and forms of inflammation that vary throughout the MS continuum. Separating these factors from one another has been an obstacle for researchers in the search for certain MS biomarkers. To navigate this challenge, researchers set out to distinguish and identify markers for acute inflammatory relapse in the CSF from biomarkers of nonrelapsing progression in patients with MS.
Data were gathered from the anti-CD20 Ocrelizumab Biomarker Outcome Evaluation (OBOE) study where patients with primary progressive MS (PPMS) or relapsing MS (MS) underwent blood and serial CSF assessments. The authors noted the value of ocrelizumab in the OBOE study due to its impact on progressive and relapsing biology outcomes, which offers the opportunity to more distinctly measure nonrelapsing progressive biology.
Patients with RMS received lumbar puncture (LP) at baseline before they were administered ocrelizumab. They were subsequently randomized into 3 treatment arms dependent on their prior experiences with disease-modifying therapy (DMT). This split would determine whether they received their second round of LP at week 12, 24, or 52. A comparator group of patients with RMS underwent LP 12 weeks prior to receiving ocrelizumab and again immediately after. Those with PPMS had LPs at baseline and week 52. For all patients, blood sampling, neurological exam, and assessment with the Expanded Disability Status Scale (EDSS) were conducted at weeks 12, 24, 48 and 52. MRIs conducted at baseline were additionally compared to 52 to monitor slowly expanding lesions (SELs). Additionally, the researchers used a single-site confirmation cohort to independently evaluate results from the test-cohort regarding baseline CSF and long-term clinical follow-up.
A total of 100 patients with RMS and 31 with PPMS were eligible from the OBOE study, constituting the test cohort. Included in the confirmation cohort were 41 patients with RMS and 27 with PPMS. At baseline, both groups had similar levels of B (0.056/μL vs 0.077/μL) and T cells (2.19/μL vs 3.46/μL); however, patients with RMS had higher levels of CSF neurofilament light (NfL) and C-X-C motif chemokine 13 (CXCL13) levels compared with the PPMS group.
For those in the test cohort, there were no significant correlations observed between GFAP and measures of acute inflammation; however, researchers found associations between elevated GFAP and larger proportions of T2 lesion volume (T2LV) in SELs (r, 0.24), total count of SEL (r, 0.33), and reduced T1-weighted (T1w) intensity in SELs (r, –0.033). Furthermore, elevated levels of NfH were also linked to less T1w intensity in SELs (r, –0.28) and SEL count (r, 0.25).
The authors noted that levels of NfL, B cells, and T cells were lowered after ocrelizumab treatment across patients with RMS and PPMS. At week 52, they also observed reductions in measures of acute inflammation and CSF, including lymphocyte measures sCD27 (RMS: −35.3%; PPMS: −19.2%), sBCMA (RMS: −33.6%; PPMS: −21.3%) and sTACI (RMS: −47.6%; PPMS: −27.8%), as well as chemokine/cytokine measures CXCL10 (RMS:−22.8%) and CXCL13 (RMS: −63.2%). NfH (RMS: −19.6%) and glial measures YKL-40 (RMS:−19.9%;PPMS: −7.7%) and TREM2 (RMS: −12.1%) exhibited modest reductions.
In the confirmation cohort, CSF GFAP at baseline was linked to future risks of disability progression at week 24 (CDP24; HR, 2.1; 95% CI, 1.3-3.4; P = .002) dependent on individual EDSS scores. Future CDP24 was not linked to serum GFAP; however, serum GFAP and CSF demonstrated a moderate association (r, 0.43; P = .004). These results from the confirmation cohort let the authors to conclude that elevated levels of CSF GFAP were connected to the clinical progression of MS.
“Overall, our study revealed shared mechanisms in RMS and PPMS, bolstering the concept that a biological disease continuum exists across MS clinical phenotypes,” Cross et al added. “The findings underscore a role for glial activity and chronic inflammation.... In nonrelapsing progressive pathobiology and identify GFAP and NfH as more specific candidate biomarkers for progressive biology, potentially improving on NfL, which reflects both injury from acute disease activity and from insidious injury.”
Reference
Cross AH, Gelfand JM, Thebault S, et al. Emerging cerebrospinal fluid biomarkers of disease activity and progression in multiple sclerosis. JAMA Neurol. Published online March 11, 2024. doi:10.1001/jamaneurol.2024.0017
Dr Kathy Zackowski Discusses the Importance of Rehabilitation Research and Trials in MS
April 26th 2024Kathy Zackowski, PhD, National MS Society, expresses the inherent value of quality rehabilitation trials for broadening clinical understandings of multiple sclerosis (MS) and bettering patient outcomes.
Read More
Examining Low-Value Cancer Care Trends Amidst the COVID-19 Pandemic
April 25th 2024On this episode of Managed Care Cast, we're talking with the authors of a study published in the April 2024 issue of The American Journal of Managed Care® about their findings on the rates of low-value cancer care services throughout the COVID-19 pandemic.
Listen
Navigating Health Literacy, Social Determinants, and Discrimination in National Health Plans
February 13th 2024On this episode of Managed Care Cast, we're talking with the authors of a study published in the February 2024 issue of The American Journal of Managed Care® about their findings on how health plans can screen for health literacy, social determinants of health, and perceived health care discrimination.
Listen
