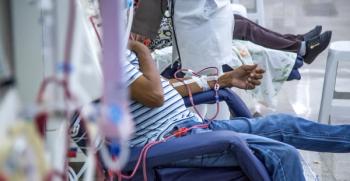

Jennifer Flythe, MD, MPH, discusses individualizing dialysis volume management and why guideline-directed therapy use lags in advanced CKD.
The American Journal of Managed Care
A comparison of 2013 and 2022 data shows that cancer costs are not uniformly rising. Costs decreased for metastatic colorectal cancer but increased for both metastatic non–small cell lung cancer and multiple myeloma.
ABSTRACT
Objectives: Cancer is cited by most employers as the leading condition driving rising health care benefit costs. This study examined the components of and trends in health care costs for patients with 3 advanced cancers, focusing on employer-sponsored insurance. We evaluated how the costs of various cancer care modalities changed between 2013 and 2022 during a period marked by the introduction of novel therapies alongside generic and biosimilar competition.
Study Design: Retrospective observational claims analysis.
Methods: Using MarketScan Commercial Claims and Encounters data, we compared 12-month health services costs for patients newly diagnosed with metastatic colorectal cancer, metastatic non–small cell lung cancer (NSCLC), or multiple myeloma in 2013 vs 2022.
Results: Metastatic colorectal cancer costs decreased 15% (from $239,003 in 2013 to $203,499 in 2022), coinciding with generic competition for chemotherapy and biosimilar entry for supportive medications. Conversely, costs for metastatic NSCLC increased by 25% (from $220,662 to $276,883), and costs for multiple myeloma increased by 51% (from $216,337 to $327,495), both due to immunotherapy. Censoring rates were lower in 2022 for all 3 cancers, significantly so for metastatic NSCLC.
Conclusions: Cancer costs for employers are not uniformly increasing, but instead, shifting based on market competition and therapeutic innovation. Where costs are rising, they are driven by novel therapies that offer a potential value trade-off, coinciding with survival improvements reported in the literature.
Am J Manag Care. 2026;32(10):548-555
Takeaway Points
Employer spending on cancer is shifting, not simply increasing.
Employers are facing increasing costs for health care benefits. In 2025, 88% of employers cited cancer as the top condition driving their costs.1 These concerns track with the medical science: Over the past 20 years, a revolution in medical therapy has transformed treatment for many types of cancer, driven by discoveries in targeted therapies for specific cancer mutations2 and the widespread adoption of immunotherapy.3 Together, precision medicine and immuno-oncology have dramatically improved patient outcomes, bringing hope to a historically difficult clinical landscape.
Despite the high cost of cancer therapies, novel medications may ultimately lower overall health care spending in 2 distinct ways. First, targeted therapies and immunomodulatory agents can replace or reduce reliance on traditional modalities such as surgery, radiation, and older chemotherapies. By replacing costly surgical hospitalizations and radiation courses with advanced oncology drugs, these new agents could, in principle, deliver cost savings.
Second, market exclusivity is inherently time limited. Although patent protection is frequently prolonged,4 most single-source branded drugs eventually face generic competition, or in the case of biologic therapies, biosimilar competition. This loss of exclusivity should lower health care costs as new market entrants drive down prices.
The extent to which these factors mitigate overall health care costs remains poorly understood.5 In this study, we examine the specific components and shifting trends of health care costs for patients diagnosed with 3 advanced cancers in 2013 and 2022, focusing specifically on individuals with employer-sponsored insurance. Our results highlight how the costs of various cancer care modalities have changed within employer-sponsored insurance over this decade.
METHODS
Rationale for Selection of 3 Cancer Types
We focused on metastatic colorectal cancer (CRC), metastatic non–small cell lung cancer (NSCLC), and multiple myeloma. Although their clinical management strategies differ significantly, collectively they offer a representative cross-section of modern oncology care. Specifically, lung cancer and CRC are the 2 leading causes of cancer-related mortality in the United States,6 and multiple myeloma, although less common, accounts for more than 12,000 deaths nationwide each year.7
The treatment of these distinct malignancies has evolved differently over the past 2 decades. Historically, CRC, particularly nonmetastatic, has been managed primarily through surgical resection, often supplemented by adjuvant systemic chemotherapy or localized radiation, and this therapeutic combination remains a highly effective, curative intervention.8 At the beginning of the 21st century, chemotherapy for metastatic CRC was largely limited to fluoropyrimidines, a class first introduced in the 1950s.8 By 2005, however, oxaliplatin (Eloxatin) and irinotecan were routinely combined with 5-fluorouracil to establish a new standard chemotherapy regimen.8 Today, both agents are available as generics and are relatively inexpensive. Treatment options expanded further when the first biosimilar for bevacizumab (Avastin)—a monoclonal antibody widely used in metastatic regimens—entered the US market in 2019, followed by several competitors. More recently, biomarker-driven genetic testing has increasingly guided the selection of targeted therapies for metastatic CRC.8 Despite these developments, the 5-year survival rate for patients with metastatic CRC remains at less than 20%.8
For multiple myeloma, the evolution of novel oncology therapies has fundamentally shifted the prognosis of a disease once considered universally fatal. Today, the treatment standard consists of proteasome inhibitors (bortezomib [Velcade], ixazomib [Ninlaro], carfilzomib [Kyprolis]), immunomodulatory agents (lenalidomide [Revlimid] and pomalidomide [Pomalyst]), and monoclonal antibodies (daratumumab [Darzalex], elotuzumab [Empliciti], and isatuximab [Sarclisa]). For transplant-eligible patients, autologous hematopoietic stem cell transplantation plays a key role. And patients with relapsed or refractory disease are now candidates for chimeric antigen receptor T-cell therapy or bispecific antibody therapy.9 Driven by these therapies, median overall survival improved from 50.7 months in a 2000-2007 cohort to 72.5 months in a 2008-2015 cohort.10 Recent data also suggest that a 4-drug regimen can achieve an overall survival rate of approximately 90% at 4 years in transplant-eligible patients.11 Treatment usually continues until failure (ie, clinical progression), at which point a new therapy is initiated. Notably, many of the key medications remained on patent through 2022.4
Treatment strategies for NSCLC fall between the poles established by metastatic CRC and multiple myeloma. Stage I and II NSCLC are managed primarily with surgery, with definitive radiation therapy generally reserved for patients who are not surgical candidates.12 However, approximately 70% of NSCLC cases present with stage III or IV disease.12 In these advanced stages, standard chemotherapy has been augmented by targeted tyrosine kinase inhibitors and immune checkpoint inhibitors developed over the last 2 decades.12
Initial systemic therapy for stage III NSCLC frequently relies on platinum- and paclitaxel-based regimens. Most of these cytotoxic drugs have been utilized for decades and are widely available as low-cost generics. From this foundation, treatment is tailored to individual tumor mutations, with heavy reliance on tyrosine kinase inhibitors.12 For stage IV disease, protocols require testing for PD-L1 expression on the tumor surface.13 When that surface marker is expressed, treatment shifts toward immune checkpoint inhibitors such as pembrolizumab (Keytruda) or atezolizumab (Tecentriq).13
The clinical integration of these targeted and immune checkpoint therapies has yielded notable survival benefits. For example, a recent report from Japan demonstrated that the median overall survival for advanced NSCLC increased from 9 months in the 2000-2006 cohort to 21 months in the 2017-2021 cohort.14
Taken together, these 3 malignancies illustrate highly divergent trajectories in both therapeutic innovation and the costs associated with it.
Cancer Cohorts
We analyzed the Merative MarketScan Commercial Claims and Encounters Database, which includes pharmacy claims, medical claims, and enrollment data on individuals in employer-sponsored health plans. Because the MarketScan data are fully deidentified, this study was exempt from institutional review board review and informed consent requirements.
First, we constructed cohorts of individuals newly diagnosed in 2013 or 2022 with 1 of 3 cancers: metastatic CRC, metastatic NSCLC, or multiple myeloma. To establish that cases were newly diagnosed, individuals were required to have continuous health insurance enrollment for at least 1 year prior to the index cancer claim to accommodate a 1-year washout period. Patients were confirmed to have the specific cancer if they had at least 1 inpatient or 2 nondiagnostic outpatient medical claims (occurring 30 to 365 days apart) with a qualifying International Classification of Diseases, Ninth Revision (ICD-9) or International Classification of Diseases, Tenth Revision, Clinical Modification (ICD-10-CM) code (eAppendix Table 1 [eAppendix available at ajmc.com]). For metastatic CRC and metastatic NSCLC, patients were also required to have at least 2 claims on different dates with an ICD-9 or ICD-10-CM code for a secondary malignant neoplasm (eAppendix Table 1). These secondary malignant neoplasm codes have demonstrated moderate to high specificity (92.7% for CRC; 76.6% for NSCLC) but limited sensitivity (42.4% for CRC; 60.7% for NSCLC) for identifying metastatic disease in a chart-validated claims study.15 Because we required 2 such codes on different dates rather than a single code, our algorithm likely trades additional sensitivity for specificity; the resulting cohorts may therefore undercount metastatic cases but are unlikely to include many patients without metastatic disease.
Each patient was followed for up to 12 months post index. Because costs were accrued from the index cancer diagnosis date rather than from the first metastatic claim, they may include services rendered prior to the identification of metastatic disease. For metastatic CRC in particular, cancer surgery costs may reflect both curative-intent resections (eg, hepatic metastasectomy) and procedures performed before claim-confirmed metastatic disease. Individuals were censored upon loss of health plan eligibility, which could indicate either a change in health insurance enrollment or death; thus, total observation periods ranged from 1 to 12 months post diagnosis. In addition to tracking total follow-up months, we calculated the number of months elapsed since the initial metastasis. From this, we derived the proportion of metastatic months as the ratio of months with documented metastatic disease to total observed months. For multiple myeloma, all observed months were classified as metastatic given the systemic nature of the malignancy.
Additional patient characteristics extracted from enrollment files included age at diagnosis, sex, geographic region (Northeast, Midwest, South, West), and health plan type (exclusive provider organization/health maintenance organization, preferred provider organization/point-of-service/comprehensive, consumer-directed health plan, high-deductible health plan).
Health Services Costs
We classified all medical and pharmacy claims into 23 granular inpatient, outpatient, and pharmacy categories. Inpatient services were divided into cancer surgery, radiation therapy, chemotherapy, other cancer services, and other noncancer services. Outpatient services included cancer surgery, radiation therapy, chemotherapy (subdivided into cytotoxic, immunotherapy, hormonal, and administration), supportive cancer medication, other noncancer medication, diagnostic services, emergency department services, physician’s office services, other cancer services, and other noncancer services. Pharmacy claims were categorized as chemotherapy (cytotoxic, immunotherapy, or hormonal), supportive cancer medication, or other noncancer medication. Inpatient claims were classified using the International Classification of Diseases, Ninth Revision, Clinical Modification and the International Classification of Diseases, Tenth Revision, Procedure Coding System procedure codes and Medicare Severity Diagnosis-Related Groups, and outpatient claims were classified using Current Procedural Terminology, the Healthcare Common Procedure Coding System, and place-of-service codes. Pharmacy claims were categorized by National Drug Code and Micromedex Red Book therapeutic class.
For each health service category, we calculated total costs by summing the allowed amounts from all associated claims for each individual. All costs were adjusted to 2024 US$ using the Consumer Price Index for medical care; because this is a composite index, real cost changes within individual service categories may reflect category-specific price inflation as well as utilization changes.
Econometric Analysis
The primary outcome was total health services costs per patient in 2022 compared with 2013, overall and at 3 and 12 months post diagnosis; secondary outcomes were costs in each of the 9 aggregated service categories described below. We conducted both bivariate and multivariable analyses. First, we calculated the means and SDs of individual characteristics for each pair of cancer cohort years and assessed the statistical significance of differences using the Kruskal-Wallis test. Similarly, we calculated the means, SDs, and P values for total health services costs across 23 granular categories (eAppendix Tables 2-4) and 9 aggregated categories (cancer surgery, radiation therapy, cytotoxic chemotherapy, immunotherapy, supportive cancer medication, diagnostic services, other inpatient, other outpatient, and other medication). This more condensed classification mainly consolidates inpatient, outpatient, and pharmacy-specific measures.
Finally, we performed a series of multivariable regression models of total health services costs and the 9 aggregate cost measures. Specifically, for each cancer type and cost-dependent variable, we estimated a generalized linear model with a γ family and a log link—to better fit the highly right-skewed and kurtotic distributions—with the following covariates: months observed, proportion of months metastatic, censored (ie, died or disenrolled), age, sex, and binary indicators for geographic region (Midwest, South, and West vs Northeast) and health plan type (exclusive provider organization/health maintenance organization, consumer-directed health plan, and high-deductible health plan vs preferred provider organization/point-of-service/comprehensive plans). Importantly, the models also included an indicator to capture the effect of year (2022 vs 2013) as well as its interaction with months observed, proportion of months metastatic, and censoring. (Complete model results are presented as cost ratios in eAppendix Tables 5-7.) For ease of interpretation, the marginal effects in US$ of 2022 (compared with 2013), overall, and at 3, 6, 9, and 12 months post diagnosis are reported. These were computed as average marginal effects using the margins command: the discrete change in predicted costs for 2022 vs 2013 on the original dollar scale, averaged across all observations, with delta-method SEs; the time-specific estimates evaluate the same contrast at 3, 6, 9, and 12 months observed. All analyses were performed in Stata, version 19.5 (StataCorp LLC).
RESULTS
Table 1 presents patient characteristics for each cancer type and year cohort. Sample sizes were smaller in 2022 than in 2013 for all 3 cancers (44% smaller for metastatic CRC, 65% for metastatic NSCLC, and 56% for multiple myeloma), reflecting the contraction of the MarketScan commercial population over this period, along with shifts in its geographic and plan-type composition. The steeper decline for NSCLC is consistent with falling lung cancer incidence over the decade, in contrast to rising CRC incidence among adults younger than 50 years.16 The 2013 and 2022 cohorts were similar in age, although the approximately 1-year difference for metastatic NSCLC (mean, 56.0 vs 57.1 years) was statistically significant. Patients with metastatic NSCLC and multiple myeloma were somewhat less likely to be male in the 2022 cohort than in the 2013 cohort. The mean number of months observed was slightly higher in 2022 across all 3 cancer types. Median follow-up was 12 months for all cohorts except metastatic NSCLC in 2013, for which it was 11 months (IQRs: 10-12 months in 2013 and 11-12 months in 2022 for metastatic CRC; 6-12 and 7-12, respectively, for metastatic NSCLC; and 12-12 in both years for multiple myeloma). In the metastatic NSCLC groups, the 2022 cohort had a mean metastatic disease duration of almost 1 month longer, perhaps reflecting earlier detection of secondary malignancies. Lastly, all 3 cohorts had slightly lower rates of censoring in 2022 than in 2013: 29% vs 33% (P = .07) for metastatic CRC, 48% vs 56% for metastatic NSCLC (P < .01), and 25% vs 27% (P = .44) for multiple myeloma. These results may suggest improvements in cancer survival over the 10-year period.
The Figure shows mean costs (in 2024 US$) for each cancer type over the 12 months following initial diagnosis. Mean costs for patients with metastatic CRC decreased 15%, from $239,003 in 2013 to $203,499 in 2022 (P < .01). As expected, cancer surgery was the largest contributor to total costs for metastatic CRC and declined slightly from $51,677 (22%) in 2013 to $47,018 (23%) in 2022. Although radiation therapy costs remained steady at 5% to 6% of the total for metastatic CRC, cytotoxic chemotherapy costs dropped substantially, from $25,682 in 2013 to $10,946 in 2022 (P < .01). Similarly, the cost of supportive medications for metastatic CRC, including filgrastim (Neupogen) to treat neutropenia and epoetin alfa to treat anemia, declined significantly by $6146 (P < .01) during the period. Immunotherapy costs for metastatic CRC were largely unchanged at approximately $26,000, as these agents were already established in the treatment paradigm by 2013. Other notable cost differences include diagnostic services (lower by $3823 in 2022; P < .01), other outpatient services (lower by $9587 in 2022; P < .01), and other medications (higher by $1571 in 2022; P = .03).
Cost trends for metastatic NSCLC diverged sharply from those for CRC. Total 12-month costs per patient rose 25%, from $220,662 in 2013 to $276,883 in 2022 (P < .01). Most of the increase came from immunotherapy, which rose from $12,854 per patient in 2013 (6% of total costs) to $65,555 in 2022 (24% of total costs; P < .01). For metastatic NSCLC, cancer surgery costs were largely unchanged, whereas costs declined for supportive cancer medications (–$7393; P < .01), diagnostic services (–$1788; P = .03), and other outpatient services (–$8899; P < .01). Other medication costs were somewhat higher in 2022 vs 2013, as was also the case for metastatic CRC.
Finally, the overall cost per patient with multiple myeloma rose dramatically from $216,337 per patient in 2013 to $327,495 in 2022, a 51% increase (P < .01). As with metastatic NSCLC, immunotherapy costs were the bulk of the increase, rising significantly (P < .01) from $21,216 per patient in 2013 (10% of total costs) to $128,658 in 2022 (39% of total costs). Cancer surgery costs—the category that captured stem cell/bone marrow transplants—increased from $34,912 in 2013 to $40,957 in 2022 (P < .01).
Table 2 presents results from multivariable cost models, including the average marginal effects (in 2024 US$) of 2022 vs 2013 overall and at 3, 6, 9, and 12 months post diagnosis. These adjusted results largely confirm unadjusted findings. For metastatic CRC, total health services costs were, on average, $37,198 lower (P < .01) across the full sample and $42,428 lower (P < .01) when estimated at 12 months of follow-up. These marginal effects were derived from the full regression model, which included all patients regardless of censoring status, with censoring accounted for via a covariate and its interaction with year. Significant cost decreases included cytotoxic chemotherapy (–$15,820; P < .01), supportive cancer medication (–$6318; P < .01), diagnostic services (–$4770; P < .01), and other outpatient services (–$12,499; P < .01). The overall adjusted difference in cancer surgery costs was not statistically significant (–$4388; P = .13).
Metastatic NSCLC costs were, on average, higher by $47,316 in 2022 compared with 2013 (P < .01) and higher by $58,332 (P < .01) when evaluated at 12 months of follow-up. As demonstrated in the unadjusted results, immunotherapy costs accounted for most of the difference, increasing by $50,489 per patient (P < .01) over the 10-year period. Adjusted costs also increased for radiation therapy ($5535; P < .01) and cytotoxic chemotherapy ($5893; P = .02) in 2022 compared with 2013. Other inpatient costs increased by $8432 (P = .04) and other outpatient costs decreased by $13,211 (P < .01) from 2013 to 2022. As in metastatic CRC, metastatic NSCLC costs for supportive cancer medication and diagnostic services were both significantly lower in 2022 compared with 2013.
The multivariable model results for multiple myeloma were most striking. Total health services costs were higher by $99,745 in 2022 compared with 2013 (P < .01) and higher by $124,879 (P < .01) when evaluated at 12 months of follow-up. As demonstrated in the unadjusted results, immunotherapy costs explained nearly all of the difference, increasing by $100,630 per patient (P < .01) over the 10-year period. Aside from a slight increase in supportive cancer medication and other medication costs as well as a decrease in other outpatient services costs, no other significant cost differences emerged.
DISCUSSION
The 21st-century paradigm shift in oncology—driven by the advent of targeted therapies and immunotherapies—has delivered remarkable clinical outcomes alongside unprecedented financial strain for employers.1 Oncology medications frequently serve as the primary drivers of escalating specialty spend.1 Notably, several medications indicated for the high-cost malignancies analyzed in this article—metastatic CRC, metastatic NSCLC, and multiple myeloma—rank among the highest revenue-generating products in the pharmaceutical market.17
Our findings add important nuance to the overall narrative of a health care system burdened by escalating cancer care costs. Recent therapeutic innovation has transformed outcomes for some cancers more than others, and financial consequences for payers are equally uneven—as the divergent cost trajectories for metastatic CRC, metastatic NSCLC, and multiple myeloma in this study make clear.
Metastatic NSCLC and multiple myeloma now have a variety of effective therapies available compared with 2013, many of them still under patent protection. Total 12-month costs in our 2022 cohorts reached $276,883 for metastatic NSCLC and $327,495 for multiple myeloma.
Higher treatment costs have coincided with meaningful survival gains, particularly for multiple myeloma. For example, one study reported median overall survival of approximately 12 years among patients with multiple myeloma aged 70 years or younger who received induction therapy with at least 2 novel agents, compared with about 5.5 years for those who received conventional therapy (143.3 vs 65.7 months).10 Five-year survival for lung cancer nearly doubled over a similar period, from 15% in 1995 to 1997 to 27% in 2014 to 2020, reflecting broader improvements across stages that include the metastatic population studied here.16
In contrast, metastatic CRC costs declined 15% over the study period, consistent with a treatment landscape shaped more by generic and biosimilar competition than by patent-protected agents. Reductions in cytotoxic chemotherapy, supportive medications, and other outpatient services accounted for the bulk of the decrease. Continued generic competition for irinotecan and oxaliplatin and the introduction of biosimilars for filgrastim and epoetin alfa may have contributed to these decreases; however, this analysis did not distinguish price changes from changes in utilization or treatment mix. Immunotherapy costs, while present, were largely stable across the decade, as the targeted biologic agents used in CRC (eg, bevacizumab, cetuximab) had already entered the treatment paradigm by 2013.
Although the cost increases observed for metastatic NSCLC and multiple myeloma in the first 12 months post diagnosis coincide with documented survival improvements in the literature—approximately 6 additional months for metastatic NSCLC18 and 2.5 years for multiple myeloma19—our analysis is limited to early disease trajectory and does not capture lifetime costs. A formal cost-effectiveness analysis over the full disease course would be required to assess the long-term economic value of these therapeutic advances.
Our findings speak directly to 2 arguments commonly made in support of novel cancer therapies. The first is that new medications reduce reliance on other treatment modalities, particularly surgery and radiation therapy. We found no statistically significant overall adjusted decrease in cancer surgery costs for either metastatic CRC or metastatic NSCLC, whereas radiation therapy costs increased significantly in metastatic NSCLC.
The second argument is that high medication costs are time limited by intellectual property law: Once patents expire, generic and biosimilar competition should reduce costs. Our findings offer mixed support for this view. In some cases, it appears that newer patent-protected agents replaced older ones before generic entry could take effect, so costs continued to increase. In others, patent expiration and biosimilar competition appear to have delivered meaningful cost reductions, a pattern consistent with our CRC findings.
Limitations
Our study has limitations. First, claims data lack disease staging information, so metastatic status was inferred from secondary neoplasm diagnosis codes. Second, claims data cannot distinguish between death and plan disenrollment, a limitation of particular importance in cancer populations, where mortality is substantial and cost trajectories of patients who die likely differ significantly from those who change coverage. Third, because our metastatic identification algorithm requires secondary malignant neoplasm codes within the 12-month observation window, the cohorts likely overrepresent patients with de novo metastatic or early-recurrence disease relative to those with late recurrences, which typically occur beyond 12 months. As a result, our findings may not generalize to the full spectrum of metastatic disease presentations. Fourth, our analysis was limited to the first 12 months following diagnosis and does not capture longer-term cost differences, which may be substantial given evolving treatment patterns and extended survival in later lines of therapy. Fifth, the MarketScan population contracted and shifted in composition between 2013 and 2022; although our regression models adjust for the observed demographic, regional, and plan-type differences, unmeasured changes in the contributing employers and health plans could affect the comparability of the 2 cohorts.
Despite these limitations, our study has several important strengths. We analyzed a large national sample of commercially insured patients across multiple years, allowing us to identify temporal trends in real-world treatment costs. Our comprehensive cost categorization permits detailed examination of which specific services drive overall cost changes. And our multivariable models controlled for important patient-level factors, including metastatic disease burden, follow-up duration, and demographics.
CONCLUSIONS
New cancer medications can be life-changing for patients. For employers and plan sponsors, the cost implications are nuanced—not uniformly increasing, but shifting in response to therapeutic innovation, patent expirations, and biosimilar competition. Where generic and biosimilar entry has taken hold, as in metastatic CRC, costs have fallen meaningfully. Where novel patent-protected therapies dominate, as in metastatic NSCLC and multiple myeloma, costs have risen substantially—but in tandem with documented improvements in patient survival. For employers navigating cancer benefit design, these findings suggest the central question may be less about whether costs are rising and more about which therapies are driving them and what they deliver in return.
Author Affiliations: RxEconomics LLC (MCR), Miami, FL; Employee Benefit Research Institute (PF), Washington, DC; Harvard T.H. Chan School of Public Health (TAB), Boston, MA
Source of Funding: Harvard T.H. Chan School of Public Health; Employee Benefit Research Institute.
Author Disclosures: Dr Roebuck reports research and consulting services performed for the Pharmaceutical Research and Manufacturers of America and receiving funding from Harvard T.H. Chan School of Public Health. Dr Brennan reports owning stock in CVS Health. The remaining authors report no relationships or financial interests with any entity that would pose a conflict of interest regarding the subject matter of this article.
Authorship Information: Concept and design (MCR, PF, TAB); acquisition of data (PF, TAB); analysis and interpretation of data (MCR, PF, TAB); drafting of the manuscript (MCR, PF, TAB); critical revision of the manuscript for important intellectual content (MCR, TAB); statistical analysis (MCR); obtaining funding (MCR, TAB); administrative, technical, or logistic support (MCR, PF); and supervision (MCR, PF).
Address Correspondence to: M. Christopher Roebuck, PhD, RxEconomics LLC, 2101 Brickell Ave, Suite 3101, Miami, FL 33129. Email: mcr@rxeconomics.com.
REFERENCES